Meteorology Notes
Title
Meteorology Notes
Description
A notebook with notes from two meteorology lectures.
Coverage
Language
Format
One booklet with handwritten annotations
Publisher
Rights
This content is available under a CC BY-NC 4.0 International license (Creative Commons Attribution-NonCommercial 4.0). It has been published ‘as is’ and may contain inaccuracies or culturally inappropriate references that do not necessarily reflect the official policy or position of the University of Lincoln or the International Bomber Command Centre. For more information, visit https://creativecommons.org/licenses/by-nc/4.0/ and https://ibccdigitalarchive.lincoln.ac.uk/omeka/legal.
Contributor
Identifier
MHitchcockJS740899-170926-260001, MHitchcockJS740899-170926-260002, MHitchcockJS740899-170926-260003
Transcription
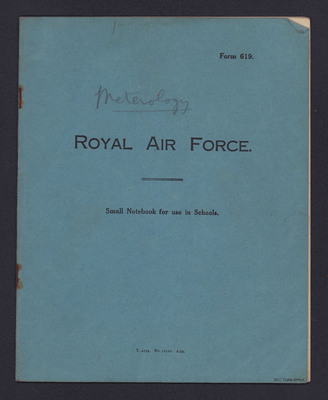
Form 619.
[inserted] Meterology [/inserted]
ROYAL AIR FORCE.
Small Notebook for use in Schools.
T.4154. Wt.IIIII. 2/39.
[page break]
[blank page]
[page break]
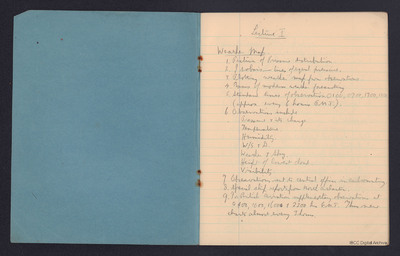
[underlined] Lecture I [/underlined]
[underlined] Weather Map. [/underlined]
1. Picture of Pressure distribution
2. Isobars – lines of equal pressure.
3. Plotting weather map from observations
4. Basis of modern weather forecasting
5. Standard times of observation 0100, 0700, 1300, 1800. (approx. every 6 hours G.M.T.).
6. Observations include
Pressure & its change
Temperature.
Humidity.
W/S & D.
Weather & Sky.
Height of lowest cloud.
Visibility.
7. Observations sent to central office in [indecipherable word] country
8. Special ship reports from North Atlantic.
9. In British Aviation supplementary observations at 0400, 1000, 1600 & 2200 hrs G.M.T. Thus new charts almost every 3 hours.
[page break]
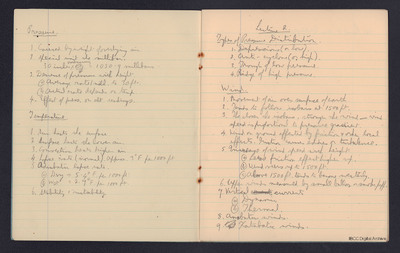
[underlined] Pressure [/underlined]
1. Caused by weight of overlying air
2. Special unit the millibar.
30 inches [deleted word] [inserted] mercury [/inserted] = 1050.9 millibars.
3. Decrease of pressure with height.
[symbol] Average rate/mill. to 30 ft.
[symbol] Actual rate depends on temp.
4. Effect of press. or alt. readings.
[underlined] Temperature [/underlined]
1. Sun heats the surface.
2. Surface heats the lower air.
3. Convection heats higher air.
4. Lapse rate (normal). Approx. 3° F per 1000 ft.
5. [indecipherable word] lapse rate.
[symbol] Dry = 5.4° F per 1000 ft.
[symbol] Wet = 2.7° F per 1000 ft.
6. Stability & instability.
[page break]
[underlined] Lecture 2. [/underlined]
[underlined] Types of Pressure Distribution [/underlined]
1. Depressions (or low).
2. Anti-cyclone (or high).
3. Trough of low pressure.
4. Ridge of high pressure.
[underlined] Wind. [/underlined]
1. Movement of air over surface of earth.
2. Tends to follow isobars at 1500 ft.
3. The closer the isobars, stronger the wind – wind speed is proportional to pressure gradient.
4. Wind on ground affected by friction & other local effects. Friction causes eddies or turbulence.
5. [indecipherable word] of wind speed with height.
(a) Less friction effect higher up.
(b) Wind veers up to 1500 ft.
(c) Above 1500 ft tends to become westerly.
6. Upper winds measured by small balloon or smoke puff.
7. Vertical [deleted word] currents.
(a) Dynamic.
(b) Thermal.
8. Anabatic winds.
9. [deleted letters] Katabatic winds.
Collection
Citation
“Meteorology Notes,” IBCC Digital Archive, accessed July 22, 2024, https://ibccdigitalarchive.lincoln.ac.uk/omeka/collections/document/36863.
Item Relations
This item has no relations.


